Cortex Explorer
Introduction
Cortex Explorer is a stand-alone MATLAB program to quickly and conveniently examine a Cortex file. Cortex Explorer offers some unique features. For example, it has a unique way to examine where in each trial spikes occur, and where in the entire data set a spike is most active. Cortex Explorer is distributed with the MatOFF data analysis package. Unlike MatOFF, Cortex Explorer will not work with older versions of MATLAB; it requires MATLAB R13 (v6.5) or later.
Installation and startup
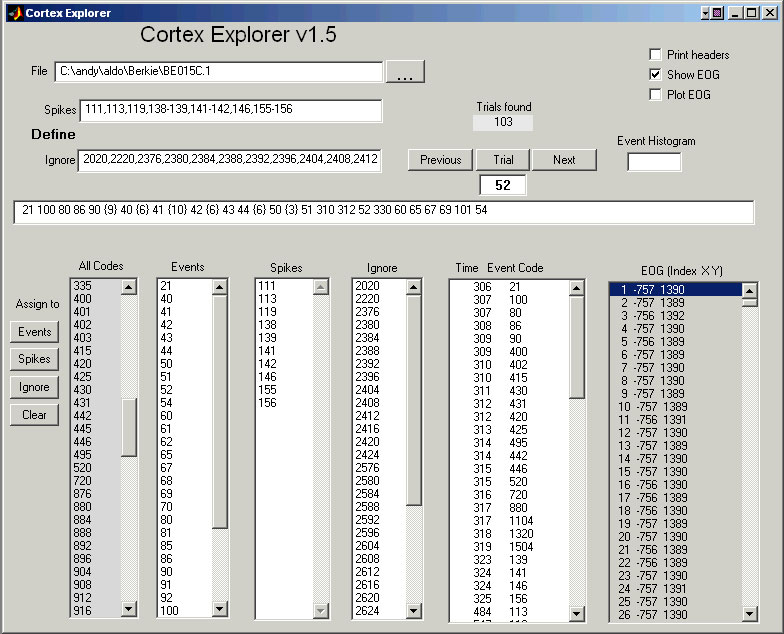
You must place the CortexExplorer directory in the MATLAB path. Enter CortexExplorer at the MATLAB prompt (not at the MatOFF prompt). Type the Cortex file name into the top File entry line to examine a file. Alternatively, use the file button next to the file entry window to get a pop-up file list. The "Load File" button on the pop-up file list will load the selected file. Once the file is loaded, Cortex Explorer will pre-process the file, then indicate the number of trials found and provide a list of every event code that occurs in the file. There is an All Codes list on the left side of the window. Every code in the data file is listed exactly once. To examine all the events in a trial, just enter a trial number in the Trial window, or use the "Previous" or "Next" buttons on either side of the Trial window. The events and their occurrence times will show up in the Time/Event Code window.
Finding out where spikes occur in a trial
Event codes can be identified as either spikes or events. Make the assignments using one of two methods. Either write a sequence for the spike codes into the Spikes entry line near the File entry line near the word "Define". The sequence syntax is in the form of a list, e.g., 1,2,3-20,33. See the MatOFF documentation for the details of sequence syntax. Or, select event codes from the list boxes (All Codes, Events, Spikes, or Ignore) and use one of the "Assign to" buttons on the left. Once the definitions are made, enter a trial number. The long horizontal display line above the list boxes will show the trial in this format:
21 100 80 86 90 {9} 40 {6} 41 {10} 42 {6} 43 44 {6} 50 {3} 51 310 312 52 330 60 65 67 69 101 54
Those event codes identified as events are show in order of their occurrence in the trial. Bracketed values are spike counts. All spikes from all identified spike events are included in each count. To view just the spikes from one unit, clear the assignments for the unwanted spikes, or assign them to ignore. Events assigned to ignore are omitted from the Time/Event Code window on the right.
Event times
The time stamp and event code for both spikes and events are displayed in the "Time Event Code" list box. Events in the "Ignore" list box are not excluded from the "Time Event Code" list box.
Headers and EOG values
If the Print headers check box is checked, each trial header will be printed on the main MATLAB command line each time a new trial is requested. If the Show EOG check box is checked, all the EOG values for the selected trial will fill the EOG list box in the format: Sample number X Y
The Plot EOG check box enables X-Y displays. When checked, Cortex Explorer
If the Print headers check box is checked, each trial header will be printed on the main MATLAB command line each time a new trial is requested. If the Show EOG check box is checked, all the EOG values for the selected trial will fill the EOG list box in the format:
Sample number X Y
The Plot EOG check box enables X-Y displays. When checked, Cortex Explorer makes a new X-Y plot of the analog each time a new trial is requested.
Event Histogram
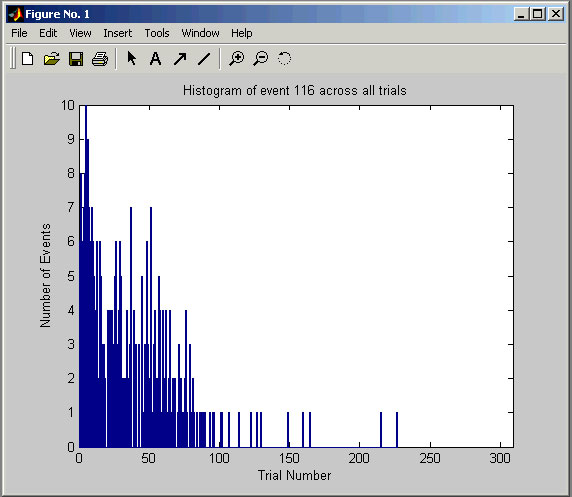
If you place an event or spike code into the Event Histogram box and select a trial, Cortex Explorer
If you place an event or spike code into the Event Histogram box and select a trial, Cortex Explorer will pop-up a graph of how many times that event code occurs in each trial. For spikes, this is a way to determine if the spike activity changed during the recording session. For events, it can show blocking patterns or, perhaps, changes in performance.
Copyright 2006, NIMH Laboratory of Systems Neuroscience Last updated 29 March 2006