Targeting of Green Fluorescent Protein to Secretory Granules in Oxytocin Magnocellular Neurons and Its Secretion from Neurohypophysial Nerve Terminals in Transgenic Mice
B.-J. Zhang, K. Kusano, P. Zerfas, A. Iacangelo, W. S. Young, III and H. Gainer
Laboratory of Neurochemistry (B.-J.Z., K.K., H.G.), and Electron Microscope Facility (P.Z.), National Institute of Neurological Diseases and Stroke, and Section on Neural Gene Expression (A.I., W.S.Y.), National Institute of Mental Health, National Institutes of Health, Bethesda, Maryland 20892
Endocrinology 143: 1036-1046, 2002
Oxytocin (OT) is a hypothalamic nonapeptide that is synthesized as part of a larger precursor protein that also contains an approximately 10-kDa protein called neurophysin at its C-terminus. This precursor protein is trafficked through the regulated secretory pathway into secretory granules and then axonally transported to and secreted from nerve terminals in the neural lobe of the pituitary. In this paper, we show that the AI-03 transgene that contains enhanced green fluorescent protein (EGFP) fused to the end of the neurophysin at the C-terminus of the OT pre-prohormone, is expressed selectively in OT-magnocellular neurons and is trafficked to secretory granules in transgenic mice. The EGFP-containing secretory granules are then transported to OT-neurosecretory terminals in the neurohypophysis, where the EGFP fluorescence undergoes depolarization-induced calcium-dependent secretion. The endogenous fluorescence in the neural lobes is sufficiently intense to image secretory events in individual OT nerve terminals (neurosecretosomes) isolated from the posterior pituitaries in these transgenic mice. [see also: Young, W.S., 3rd, Iacangelo, A., Luo, X.-Z. L., King, C., Duncan, K., Ginns, E.I. Transgenic expression of green fluorescent protein in mouse oxytocin neurons. J. Neuroendocrinol. 11: 935-940, 1999.]

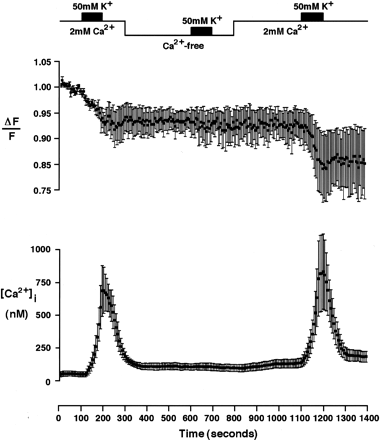
Depolarization-induced Ca2+-dependent exocytosis in EGFP-containing neurosecretosomes monitored by decreases in EGFP intensity. Upper record shows the time course of average intensity decrease (&198;F/F) during applications of 50 mM K+ in normal [Ca2+]o-containing (2 mM), in [Ca2+]o-free and after washout by normal saline (n = 5, mean ± SEM). The stimulation sequence is shown in the top abscissa. Lower record shows the corresponding average [Ca2+]i changes, which were measured alternately with the EGFP intensity changes (n = 5, mean ± SEM). Measurement intervals for EGFP intensity were about 5.6 sec, whereas those for Fura-2 signals were 7.14 sec due to off-line averaging.
