Proton Chemical Shift Imaging of Human Brain
Proton Chemical imaging is a magnetic resonance imaging method to show the concentration of several metabolites rather than imaging water. In the human brain usually three metabolites are imaged, Choline (Cho), Creatine (Cre) and N-Acetyl Aspartate (NAA). Choline is believed to be important for membranes, Creatine is part of the energy cycle in the brain, and NAA presents only in neurons and its concentration is believed to show neuronal density.
The Chemical shift imaging sequence MPCSI (http:\\bohr.nimh.nih.gov) has been developed at the NIH, first by Jeff Duyn and now for about eight years by Jan Willem van der Veen. The sequence offers a 32 x 32 CSI grid over four slices in a scan time of 27 minutes. On the 3 Tesla systems the slice thickness is 7.5 mm to reduce the effects of main field inhomogeneities in the lower slices. With a FOV of 240 mm the voxel size on 3T systems is 7.5 mm cubed. The sequence is a full oblique sequence and can be aligned with the Hippocampal areas.
The signal from lipids in the skull is suppressed with eight saturation slices, positioned around the skull. The octagonal shape follows the shape of the brain more closely than a simple square, reducing the loss of spectra in the outer cortical layer.
The sequence uses a long echo time of 280 ms. At this echo time the only metabolite signals left are NAA, Creatine, Choline, and Lactate (if present). The advantage of the long TE is the absence of signals of various other unresolved and macromolecule resonances. At field strengths of 3 Tesla these signals overlap and form a baseline in the spectrum. This baseline is very difficult to define and interferes with the quantification of the four signals from NAA, Creatine, Choline, and Lactate.
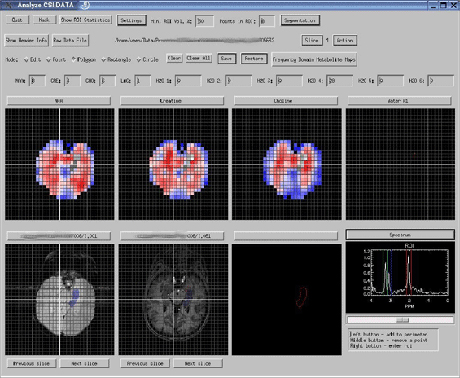
The long echo time also allows the acquisition of the full echo. The full echo can be easily Fourier transformed into a spectrum. There is no need for phasing of the spectrum which is difficult to automate. The data processing is therefore very easy and the only user interaction needed is the choice of an anatomical region of interest. Processing large numbers on patients is relatively easy and operator independent. Data processing is done by a program written at the NIH and currently supported by Alan Barnett. The program depends on a data processing package called IDL (ITT Visual Information Solutions Inc, http://www.ittvis.com/) and runs on Linux workstations. An example of the data processing is shown in Fig. 1.

Hippocampus. The top three images show the integrated lines
from the spectrum for NAA, Cre, and Cho. A ROI has been
selected in the Hippocampal area and the average spectrum
is shown in the image in the lower right. The colored vertical
lines show the integration area, from left to right Cho, Cre,
and NAA.
Alexa J. Stern, Antonina A. Savostyanova, Aaron Goldman, Alan S. Barnett, Jan Willem C. van der Veen, Joseph H. Callicott, Venkata S. Mattay, Daniel R. Weinberger, Stefano Marenco, "Impact of the Brain Derived Neurotrophic Factor Val66Met Polymorphism on Levels of Hippocampal N-Acetyl Aspartate Assessed by Magnetic Resonance Spectroscopic Imaging at 3 Tesla". Biol Psychiatry. 2008 Nov 15;64(10):856-62

