
Single Voxel GABA Edited Spectroscopy in the Human Brain
With the standard single voxel spectroscopy it is not possible to measure the GABA signal. It is too weak and too much obscured by other signals. To filter the GABA signal from the other signals a special technique is used called spectral editing.
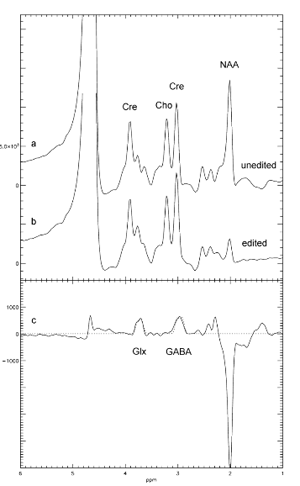
In this method use is made of the J-coupling between the GABA 3C protons at 1.9 ppm and the 4C protons at 3.0 ppm. With a set of selective inversion pulses, only the GABA protons at 1.9 ppm are inverted for half an echo time. The effect of the J coupling of the 1.9 ppm protons to the 3.0 ppm will now be compensated for the complete echo time. When the J coupling is compensated the side peaks of the GABA triplet at 3.0 ppm will not be inverted over the echo time (68 ms = 0.5/J). By subtracting a regular unedited (Fig. 3a) and an edited (Fig. 3b) spectrum a doublet results at 3.0 ppm for the GABA 4C protons (Fig. 3c).
the GABA editing sequence.
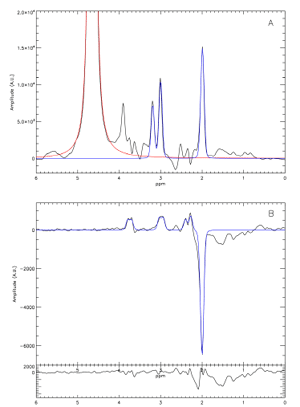
The GABA level is estimated from the ratio to Creatine. Creatine is a reliable signal to compare the GABA signal to, it is stable, appears only in tissue and not in CSF, and it has the same line shape as the GABA signal. Other methods like water and RF normalizations generally result in higher deviations for the GABA level (see reference). The GABA data processing in IDL follows two steps: the regular metabolite signal amplitudes for NAA, Creatine, and Choline are estimated by non-linear fitting lineshapes with a shared lineshape and a shared offset from the literature metabolite frequencies. The fit is made to the spectra from the unedited acquisitions (see Fig. 4A). The linewidth and frequency parameters of this metabolite fit are used to form a GABA reference signal that is fitted to the difference signal (see Fig. 4B). The shared lineshape between GABA and Creatine reduces the error in the GABA to Creatine ratio.
concentration by non-linear curve fitting.
Reference: Stefano Marenco, Antonina A. Savostyanova, Jan Willem van der Veen, Matthew Geramita, Alexa Stern, Alan S. Barnett, Bhaskar Kolachana, Fengyu Zhang, Joseph H. Callicott, Richard E. Straub, Jun Shen, Daniel R. Weinberger, “Genetic modulation of GABA levels in the anterior cingulate cortex by GAD1 and COMT”, Neuropsychopharmacology 2010 35(8); 1708-1717.